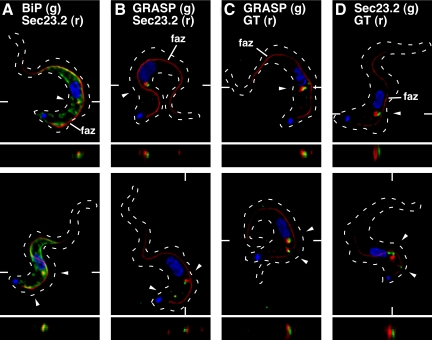
Figure 7.
Localization of ERES components relative to the flagellar attachment zone, ER, and Golgi. Epitope-tagged cell lines were fixed/permeabilized and stained with combinations of anti-tag and anti-native marker protein antibodies as appropriate. For each set of staining conditions, representative three-channel summed stack projections of cells containing one (top row) or two (bottom row) ERES:Golgi junctions are presented (arrowheads). Cells were also stained with mAb L3B2 (anti-FAZ filament, red) to reveal orientation relative to the longitudinal FAZ (indicated in top row only) and with DAPI to mark the central nucleus and posterior kinetoplast. TbSec23.2HA-expressing cells were stained with anti-HA (red) to detect the tagged ERES marker and with either anti-BiP (A) or anti-GRASP (B) to localize these endogenous ER and Golgi matrix markers, respectively (green). Cells expressing TbGT15:Ty alone (C) or simultaneously with TbSec23.2:HA (D) were stained with anti-Ty (red) to detect the tagged glycosyltransferase and with either anti-GRASP (C) or anti-HA (D) to detect the Golgi matrix and ERES, respectively (green). Dashed outlines mark the cellular boundary as obtained from matched DIC images (data not shown). The planes of z transects through selected ERES:Golgi junctions (shown below each image) are indicated by marginal hatch marks in the three channel x-y images.

