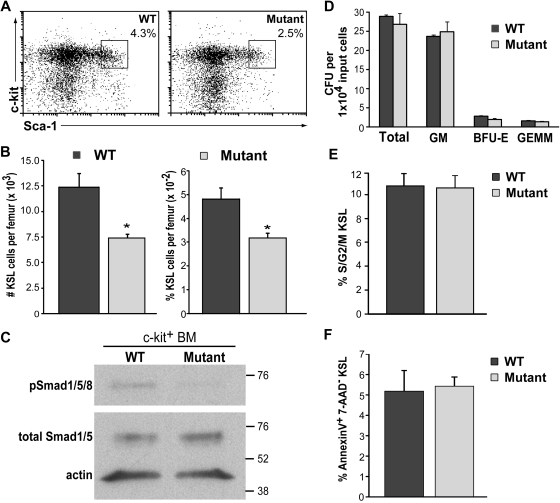
Figure 3.
KSL number is reduced in BMP4 hypomorphs. (A) Representative FACS plots of c-kit+/Sca-1+/lin− (KSL) cells (boxed areas) isolated from 8- to 12-week-old WT and BMP4 hypomorphic mice. Live cells within the lineage-negative gate are shown. (B) Pooled data for total KSL number per femur (left) and the percentage of KSL cells per femur (right) are shown. Significantly fewer KSL cells are detected in the BMP4 hypomorphs (n = 15) relative to that in age-matched controls (n = 14). *P < .004. (C) Analysis of phosphorylated (p) Smad1/5/8 in sorted c-kit+ BM cells from WT and mutant mice. In this representative Western blot, 2.4 × 10⁴ cells from each genotype were assayed with an antibody that recognizes pSmad1, pSmad5, and pSmad8 (∼ 60 kDa, top panel). The blot was stripped and reprobed (bottom panel) with antibodies that recognize total Smad1 and Smad5 (∼ 60 kDa) and actin (∼ 42 kDa). The positions of molecular weight markers (in kilodaltons) are indicated on the right. (D) Hematopoietic progenitor activity assays. Progenitor activity (colony-forming units [CFUs]) in 104 nucleated BM cells was assessed in methylcellulose cultures. Pooled data from 4 independent experiments performed in triplicate are shown. (E) KSL cell-cycle analysis. The fraction of sorted KSL cells in S/G2/M was determined for each genotype in 5 independent experiments. Significant differences in KSL cell cycle status between WT and mutant mice were not detected. (F) KSL apoptosis analysis. Pooled results from annexin V and 7-AAD staining of KSL cells from WT and BMP4 mutant mice. Four independent experiments were performed and no significant differences were detected. Error bars show SEM.

