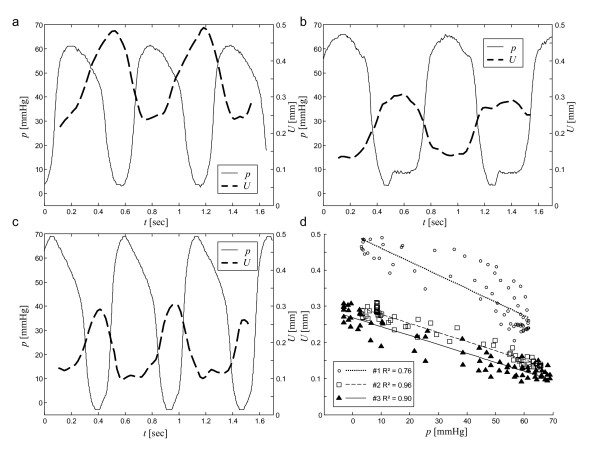
Figure 4.
Variation of wave amplitudes U(t) observed by MRE compared with invasively measured LV pressure p(t) in three pigs (a, b, and c, corresponding to animals 1, 2 and 3). The animals investigated had different heart rates and pressure levels, giving rise to different relative wave amplitude changes and amplitude offsets in MRE. Figure d shows the linear regression of U(p) in all pigs.

