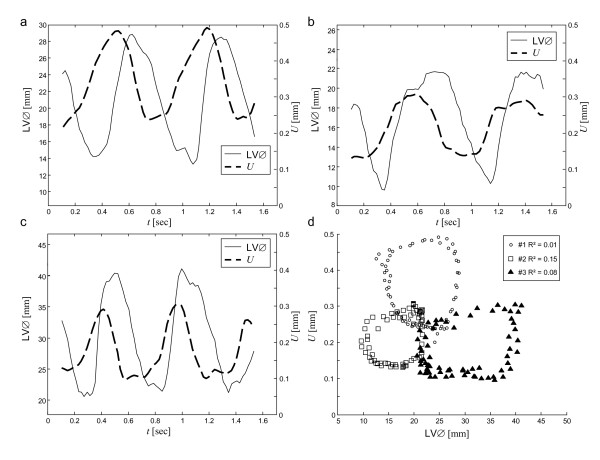
Figure 5.
Amplitudes U(t) and LV diameter (LV∅) determined from the MRE magnitude images along the apical short cardiac axis. (a, b, and c, corresponding to animals 1, 2 and 3). Figure d shows the change in wave amplitudes over LV diameters, indicating that there is no linear correlation between these measures. The characteristic shape of the loops is well known from pressure-volume cycles [14,10].

