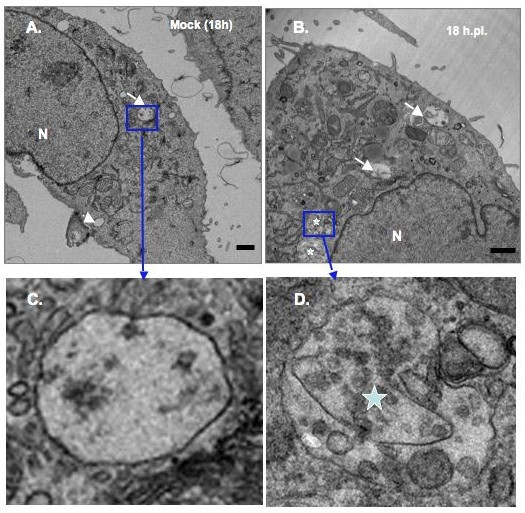
Figure 4.

Ultrastructural analysis of MDBK cells examined at 18 h.p.i. MDBK cells were mock infected or infected with BVDV at MOI of 15. Cells were harvested at 18 h.p.i and processed for TEM analysis. White arrows and arrowheads show the types of vesicles seen in mock-infected (A) or infected cells (B). Stars indicate the vesicular structures found solely in BVDV-infected cells (B). Higher magnifications of the areas in mock-infected (C) and BVDV-infected cells (D) are indicated by the rectangle boxes. Notice the presence of various size vesicles enclosed in the large vesicular structures in (D). Bars = 1 μm.
