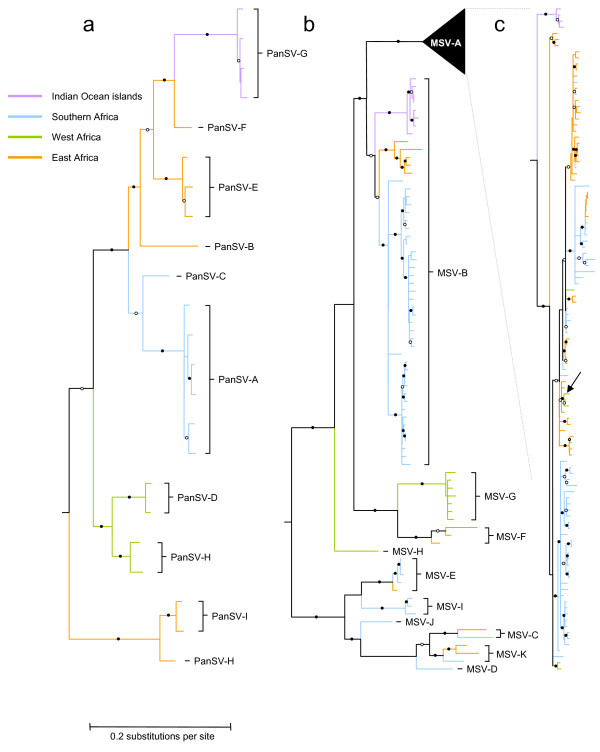
Figure 2.
Maximum likelihood phylogenetic trees (best fit nucleotide substitution models = GTR+G4 for PanSV tree and GTR+I+G4 for the MSV tree) depicting the sampling locations of 23 PanSV (tree a) and 181 MSV isolates (trees b and c). Branches are colored according to sampling locations (blue = southern African lineages, orange = East African lineages, green = West African lineages, purple = Indian Ocean island lineages). Wherever under a maximum parsimony criterion, it is <60% certain that ancestral sequences represented by tree nodes are from one of the four regions, the branches basal to that node have been left uncoloured. Whereas branches marked with filled and open circles were supported in >90% and 70-89% of bootstrap replicates, respectively, branches with <50% bootstrap support have been collapsed. The arrow on tree c indicates a clade of MSV-A sequences from West Africa nested within a clade of MSV-A sequences from East Africa indicating an instance of recent east to west movement of MSV-A isolates. All the trees were rooted on the Sugarcane streak Reunion virus isolate SSRV-Bas (not shown).

