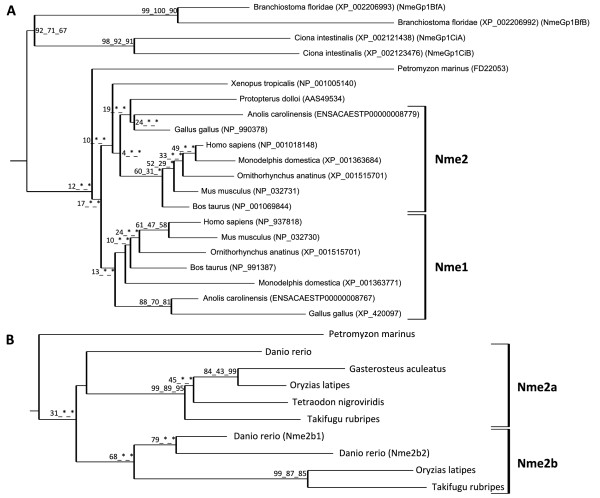
Figure 5.
Phylogenetic analysis of Nme1 and Nme2 proteins. Tetrapods Nme1 and Nme2 (A) and teleost Nme2 (B) phylogenetic trees were constructed from separate multiple alignments. Bootstrap values for neighbor-joining, maximum parsimony, and maximum likelihood methods, respectively, are indicated for each node. * indicates that the node does not exist in the corresponding tree. The consensus tree was calculated with the FIGENIX automated phylogenomic annotation pipeline [87]. For each sequence, accession number and species name are shown.

