
Figure 2.
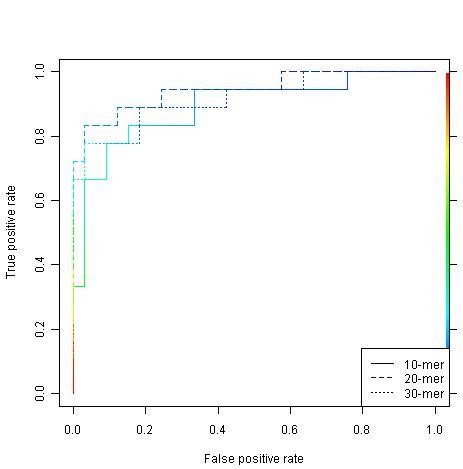
SVM ROC curves for the 10-mer, 20-mer and 30-mer data sets. The horizontal axes are the false alarm rates (1 - specificity) and vertical axes are the sensitivity. For specific threshold for discriminating between positive (true sulfotyrosine sites) and negative (unconfirmed sulfotyrosine sites) data points, there will be a pair of these two values, i.e., 1 - specificity and sensitivity. A pair of values is then represented by a point in this two-dimensional space. Each curve is made by connecting all these points. A model is said to be robust whether its ROC curve is close to the top left corner. The area under a ROC curve is a quantitative indicator of this robustness.