Figure 3.

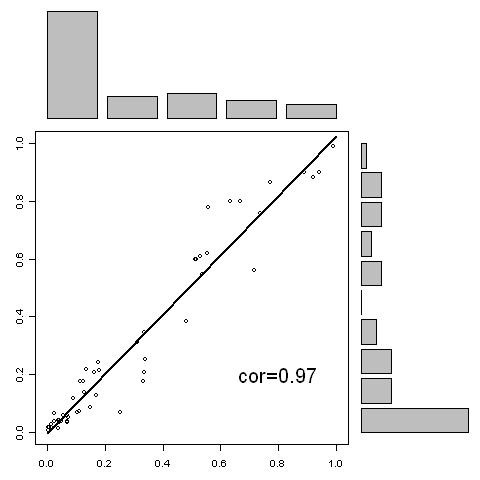
The correlation of the predictions between 10-mer model predictions (horizontal axis) and the 20-mer model predictions (vertical axis) for the blind data set.

The correlation of the predictions between 10-mer model predictions (horizontal axis) and the 20-mer model predictions (vertical axis) for the blind data set.