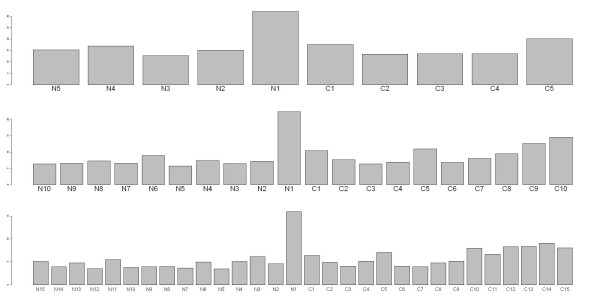
Figure 6.
The ranking results of residues in three RF models. The horizontal axis represents residue positions in peptides. The upper panel is for the 10-mer data, hence having residue positions ranging from N5 to C5. The middle panel is for the 20-mer data, hence 20 bars. The lower panel is for the 30-mer data, hence 30 bars. The vertical axis indicates the mean decrease Gini measures.

