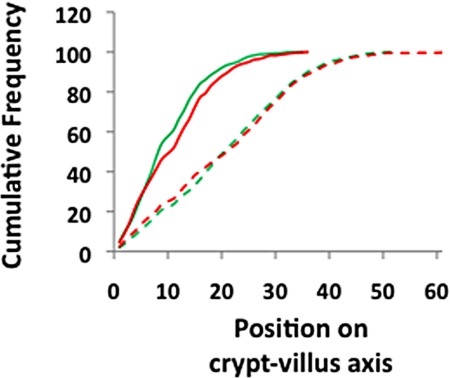
Fig. 4.
No difference in migration of enterocytes in the colons of Gstp-null ApcMin mice. Cumulative frequency plot showing distribution of BrdU-labeled cells along the length of the crypt-villus axis 2 and 48 h after exposure to BrdU. At 2 h there is no difference in distribution between Gstp-wt ApcMin and Gstp-null ApcMin mice. At 48 h, enterocytes in both Gstp-wt ApcMin and Gstp-null ApcMin mice have moved equivalent distances along the axis, indicated by a shift in the graph to the right. For all data, a minimum of three mice were used of each genotype. Solid green and red lines represent Gstp-wt ApcMin and Gstp-null ApcMin mice at 2 h, respectively, while the dashed green and red lines represent Gstp-wt ApcMin and Gstp-null ApcMin mice at 48 h, respectively. For further details, see Materials and Methods.

