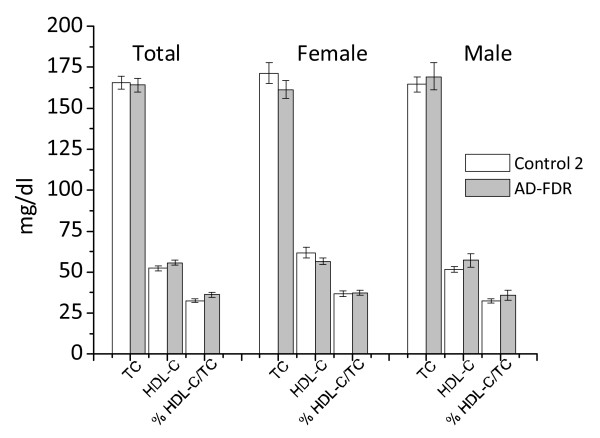
Figure 7.
Plasma lipid profile in control 2 and AD-FDR. Data are expressed as a mean ± SE of the enrolled subjects. *TC P = 0.784; HDL P = 0.154; %HDL/TC P = 0.04; TC female P = 0.185; D HDL female P = 0.304; % HDLC/TC female P = 0.05; TC male P = 0.490; HDL male P = 0.215; %HDLC/TC male, P = 0.316 of AD-FDR vs the corresponding control 2 by Student's t test.

