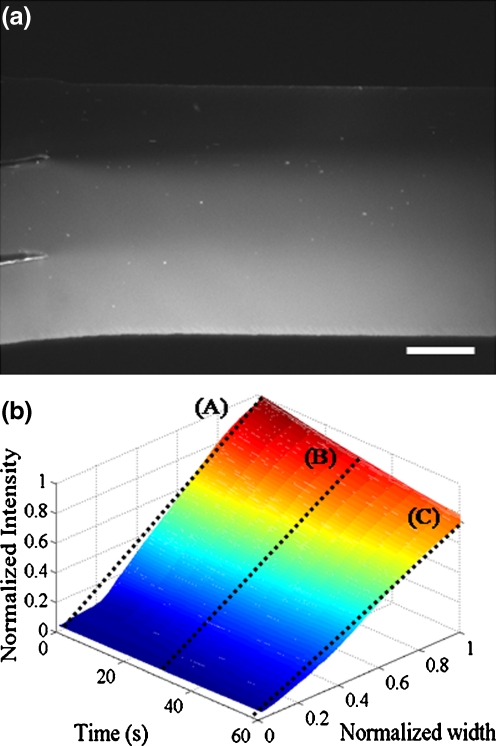
Fig. 4.
Demonstration of concentration gradient generated in the main channel by using Rhodamine B: (a) Spatial intensity distribution of Rhodamine B in the main channel downstream of the junction, where the scale bar indicates 100 µm, (b) Temporal variation of intensity distribution of Rhodamine B at 2-mm downstream from the junction after the flow is stopped using a 3-way peek valve and a 100-µL syringe

