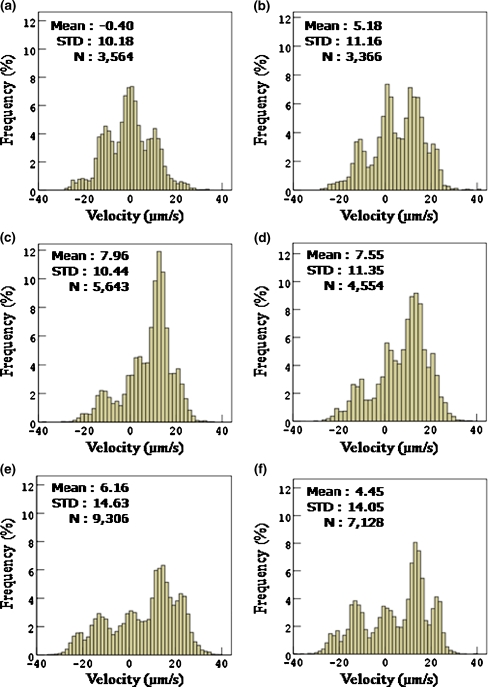
Fig. 6.
Distribution of the velocities at intervals of 0.1 s for various CG’s of L-aspartate. The abscissa represents the velocity from −40 µm/s to 40 µm/s, where the negative sign means the migration to lower concentration, and the positive sign means the migration to higher concentration. The ordinate represents the probability density of velocity. (a) CG = 0 (no L-aspartate, i.e., only motility buffer), (b) CG = 2.2 × 10⁻⁵ M/mm, (c) CG = 2.2 × 10⁻⁴ M/mm, (d) CG = 2.2 × 10⁻³ M/mm, (e) CG = 2.2 × 10⁻² M/mm, and (f) CG = 2.2 × 10⁻¹ M/mm. The numbers on the left upper corner of each chart represent mean velocity, standard deviation and total number of data, respectively

