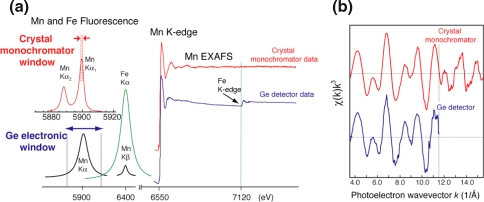
Fig. 4.
a Left (top): X-ray fluorescence of Mn and Fe. The multi-crystal monochromator with 1 eV resolution is tuned to the Mn Kα1 peak (red spectrum). Left (below): fluorescence peaks of Mn and Fe as detected using Ge-detector. The fluorescence peaks are convoluted with the electronic window resolution of 150–200 eV of the Ge-detector (black and green spectra for Mn and Fe fluorescence). Note different energy scales for the schemes shown above and below. Iron is an obligatory element in functional PS II complexes. Right: Comparison of the traditional Mn K-edge EXAFS spectrum (blue) from the S1 state PS II sample obtained with a traditional 30-element energy-discriminating Ge-detector with a spectrum collected using the high-resolution crystal monochromator (note the absence of Fe contribution). The dashed line at k = 11.5 Å−1 denotes the spectral limit of a conventional EXAFS experiment owing to the iron edge. Use of the high-resolution detector eliminates the interference of Fe and removes the limit of the energy range for Mn EXAFS data collection. b The comparison of the k-space Mn EXAFS collected with a crystal monochromator and a Ge-detector. The range of data, as indicated by k max, is inversely proportional to the resolution of the data

