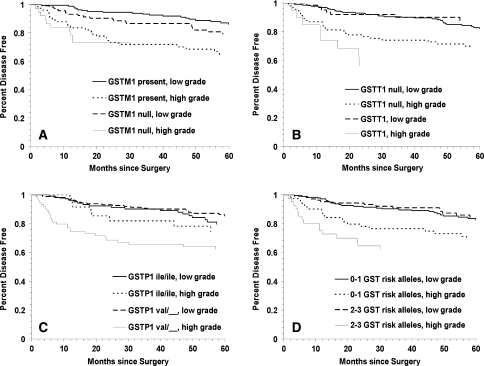
Fig. 2.
Kaplan–Meier survival curves for biochemical recurrence of prostate cancer for GST polymorphisms in high versus low tumor grade: a GSTM1 null versus GSTM1 present (log rank p = 0.0002); b GSTT1 null versus GSTT1 present (log rank p = 0.0001); c GSTP1 codon 105 Ile/Ile and Ile/Val versus Val/Val (log rank p < 0.00001) and d total number of GST high risk (variant) genotypes (log rank p = 0.0001)

