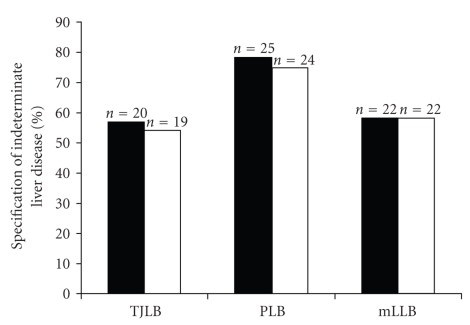
Figure 2.
Indeterminate liver disease. Black bars show the percentage of cases in which the etiology of liver disease was identified during the clinical course. The white bars show the percentage of cases in which liver biopsy contributed substantially to the establishment of the diagnosis. No difference was found between the rate of TJLB, PLB and mLLB.

