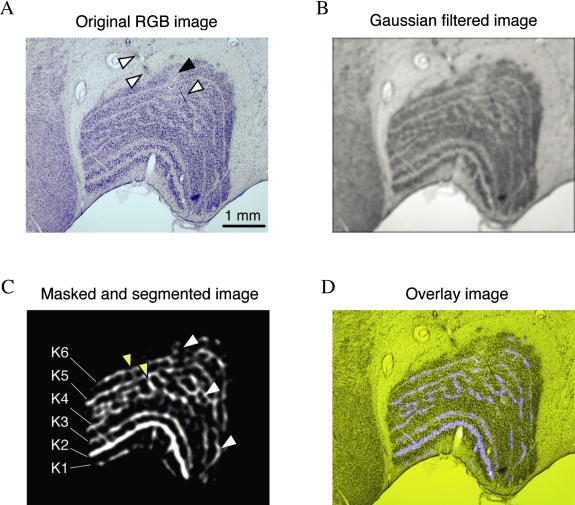
Fig 1.
Sequence of digital image processes carried out on (A) a Nissl-stained section to define the koniocellular layers and their ‘bridges’ within the LGN. (B) After applying a Gaussian filter to remove the higher spatial frequencies, (C) the low-frequency regions are segmented using an ‘opening’ filter. (D) This image is superimposed as the blue channel of the original image. The arrowheads in A indicate the paths of two electrode tracks. The black filled arrowhead indicates the site of an electrolytic lesion. The small yellow arrowheads in C indicate two koniocellular ‘bridges’ spanning the external parvocellular layers and the large white arrowheads show the positions of three B/Y cells encountered on the electrode path indicated in A.

