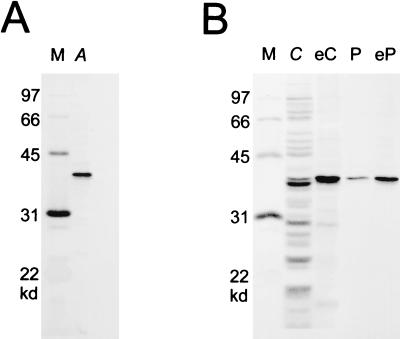
Figure 2.
Purification from E. coli of TraA-tag and cAD1 affinity chromatography. The proteins were examined by SDS/PAGE and stained with silver stain. (A) Purified TraA-tag (lane A) with molecular size markers (lane M). (B) Amino terminus-fixed cAD1 affinity chromatography of TraA-tag. Crude extract with overexpressed TraA-Tag (lane C) or purified TraA-tag (lane P) was mixed with amino terminus-fixed cAD1 affinity matrix. After incubation and washing, protein was eluted with 60 μM cAD1 (30 μl). Lane eC represents eluate from the matrix that had been mixed with crude extract. Lane eP is eluate from matrix mixed with purified TraA-Tag. Molecular size markers are in lane M.

