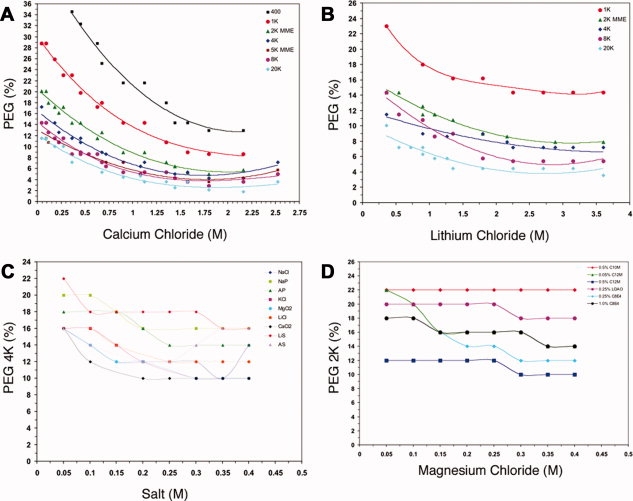
Figure 3.

The effect of detergent phase partitioning as a function of PEG, salt, and detergent. Typical summary graphs depicting the effects on detergent phase partitioning as a function of the PEG, salt, and detergent used. The generation of summary graphs facilitates the design and formulation of grid screens for crystallization trials for membrane proteins in a particular detergent system. (A) The effect on the phase boundary curve of 0.5% C8E4 with calcium chloride as a function of PEG molecular weight at 20°C. (B) The effect on the phase boundary curve of 0.05% C12M with lithium chloride as a function of PEG molecular weight at 20°C. (C) The effect on the phase boundary curve of 0.05% C12M with PEG 4000 as a function of different salts at 20°C. (D) The effect on the phase boundary curve of PEG 2000 with magnesium chloride as a function of detergent at 20°C.
