Figure 4.

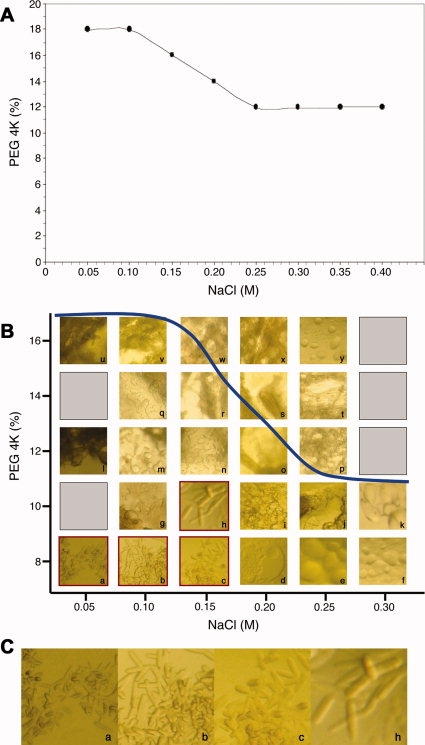
Crystallization of aromatase near the experimentally calculated phase boundary of 0.05% C12M with PEG 4000 and NaCl. (A) Experimentally determined phase boundary for 0.05% C12M, PEG 4000, NaCl. (B) Crystallization outcomes observed from a sitting-drop vapor diffusion grid screen whose cocktails were formulated based upon the experimentally determined phase boundary. The blue line represents the phase boundary for 0.05% C12M against PEG 4000 and NaCl and the lowercase letters correspond to the cocktails described in Supporting Information Table SI. Crystals of aromatase were observed in wells corresponding to cocktails a, b, c, and h (outlined in red). (C) Magnified images of the aromatase crystals in a, b, c, and h. These crystals appeared after 3 days and were less than 0.1 mm in size on their longest edge.
