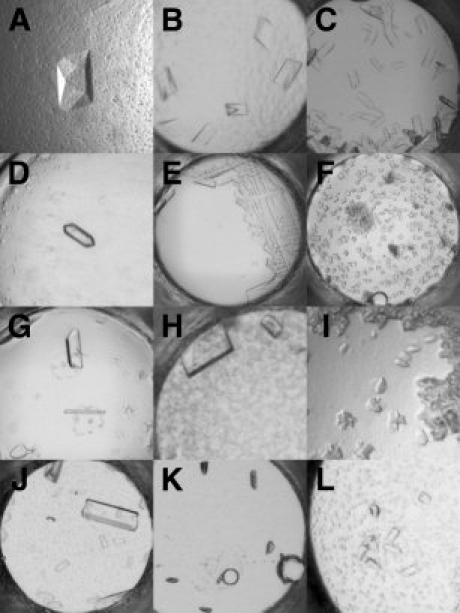
Figure 5.

Crystals of membrane proteins identified using the 1536 membrane protein screen. Crystal image, with corresponding cocktail formulation, date of first appearance in the screen, and approximate size (longest edge) for: (A) MP01: 40% PEG 400, 0.1M HEPES, pH 7.0, 0.1M ammonium sulfate, 6 weeks, 0.2 mm; (B) MP04: 30% PEG 8000, 0.1M sodium citrate, pH 5.6, 0.2M NaCl, 4 weeks, 0.2 mm; (C) MP05: 30% PEG 3350, 0.1M sodium citrate, pH 5.6, 0.1M ammonium sulfate, 1 week, 0.1 mm; (D) MP06: 20% PEG 8000, 0.1M HEPES, pH 7.0, 0.1M ammonium sulfate, 4 weeks, 0.15 mm; (E) MP07: 50% PEG 400, 0.1M HEPES, pH 7.0, 0.2M ammonium sulfate, 5 weeks, 0.2 mm; (F) MP08: 20% PEG 3350, 0.1M TRIS, pH 8.5, 0.3M NaCl, 2 weeks, 0.05 mm; (G) MP09: 32% PEG 4000, 0.1M TRIS, pH 8.5, 0.3M lithium sulfate, 5 weeks, 0.2 mm; (H) MP10: 20% PEG 400, 0.1M HEPES, pH 7.0, 0.2M ammonium sulfate, 6 weeks, 0.2 mm; (I) MP11: 30% PEG 2000, 0.1M HEPES, pH 7.0, 0.2M magnesium chloride, 6 weeks, 0.05 mm; (J) MP12: 30% PEG 400, 0.1M HEPES, pH 7.0, 0.1M NaCl, 2 weeks, 0.4 mm; (K) COX-2: 8% PEG 8000, 0.1M TRIS, pH 8.5, 0.4M magnesium chloride, 5 weeks, 0.1 mm; (L) GlpT: 40% PEG 2000, 0.1M HEPES, pH 7.0, 0.05M lithium sulfate, 1 week, 0.1 mm.
