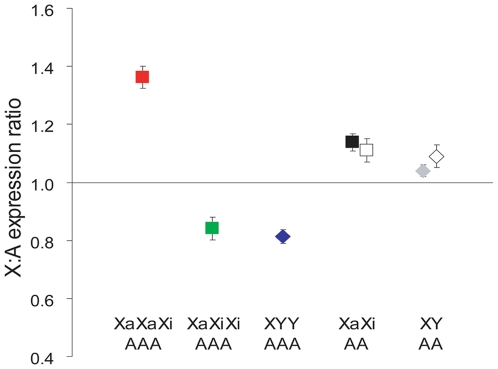
Figure 1. X:autosome expression ratios in triploid cultures.
The mean (± standard deviation) X:A expression ratios are shown for each genotype indicated at the bottom (Xa: active X chromosome, Xi: inactive X chromosome, Y: Y chromosome, A: autosome). Three individual triploid fibroblast cultures of each genotype were assayed alongside two female (black square) and two male (gray diamond) diploid fibroblast cultures. The X:A expression ratios calculated from published microarray data for adult fibroblasts from 12 female and 11 male individuals are represented by white square and white diamond, respectively [10].

