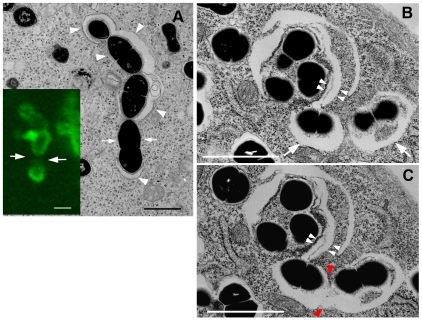
Figure 6. Precursor GcAV structure.
(A) HeLa cells expressing GFP-LC3 grown on a gridded glass bottom dish were incubated with GAS for 1 h and followed by incubation in culture medium containing antibiotics for 0.5 h. An EM image shows several isolation membranes (arrowheads) surrounding cytoplasmic GAS. A correlative confocal image showed a discontinuous GFP-LC3 pattern (lower left panel, green). Arrows indicate gaps between individual isolation membranes. (B and C) Pictures represent serial sections of the same cell 0.5 h after infection. Two individual isolation membranes enwrapping GAS (B, arrows) fused with each other at the point indicated by red arrowheads (C). Double arrowheads indicate overlapping isolation membranes around GAS. Bars, 1 µm (A–C).

