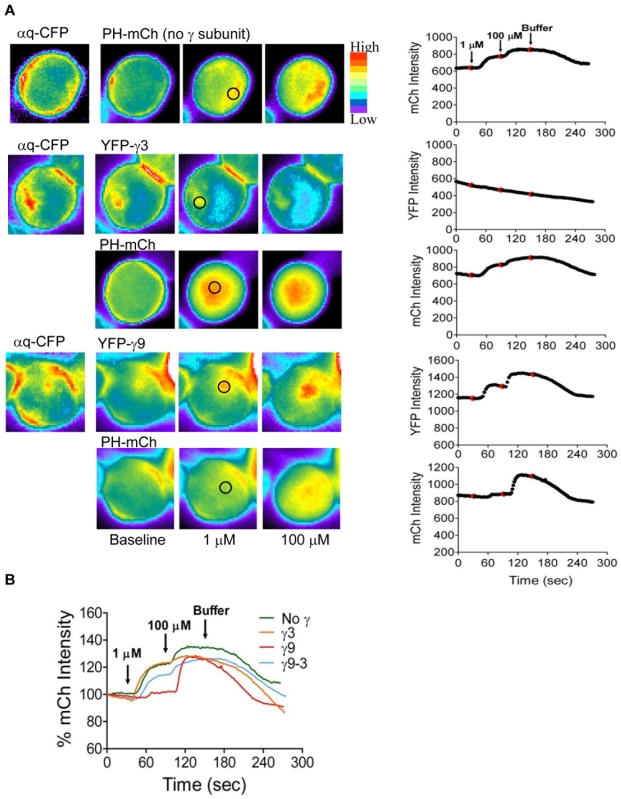
Figure 3. Responses of cells expressing different γ subunits to sequential exposure of increasing concentrations of agonist.
A. M3-CHO cells expressing αq-CFP, YFP-γ (as indicated) and PH-mCh were imaged as mentioned in Methods and Text S1. Representative images of cells exposed sequentially to 1 µM and 100 µM carbachol (agonist) are shown. Changes were measured in selected regions (black circles) in cytosol (for mCh) and endomembranes (for YFP). In the corresponding plots on the right, arrows in the top plot and red dots in all plots, indicate time points at which agonist and buffer were introduced. B. Plots of PH-mCh emission intensity for cells expressing different γ subunit types (as indicated). Basal level of mCh intensity was treated as 100%.

