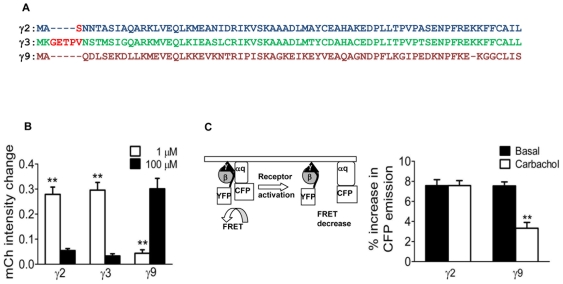
Figure 5. Differential effector and FRET responses of cells expressing different γ subunits.
A. Primary structures of γ3, γ2 and γ9. Comparison shows that γ3 has five additional residues at the N terminus compared to γ9 while γ2 has only one (highlighted residues). B. PH-mCh translocation induced by the sequential addition of agonist from cells expressing different γ subunit types (as indicated). N = 11. Results are the means ± SEM. *p<0.01, **p<0.001. C. A FRET sensor based on αq-CFP and βγ-YFP. Representation of FRET sensor (left). Bars (right) show increase in CFP emission on the plasma membrane as a result of FRET loss in presence of various γ subunits at basal (black bars) and activated (white bars) state determined as in Methods and Text S1. Results are the means ± SEM; N = 9, **p<0.001.

