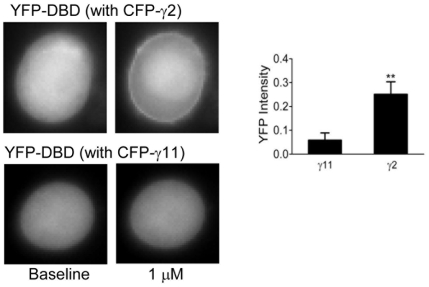
Figure 6. YFP-DBD translocation in the presence of various γ subunits.
Representative images and bar diagrams of YFP-DBD translocation are shown in the presence of 1 µM carbachol. Values were calculated as in Fig. 1B. Images of cells expressing αq with CFP-γ2 (N = 9) or CFP-γ11 (N = 10) (as indicated) and YFP-DBD were acquired as described in Methods and Text S1. Values were calculated as ratio of M-B/B as described in Fig. 1B legend. Results are the means ± SEM. **p<0.001.

