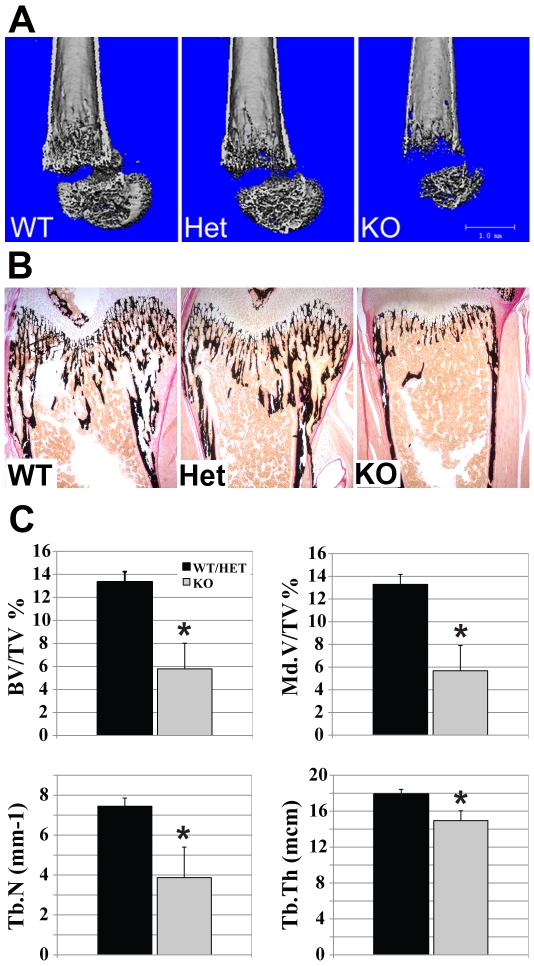
Figure 5. Histomorphometric analysis.
(A) MicroCT images of femurs from postnatal day 18 mice. Note the dramatic difference in bone structure of the femur from KO mice vs WT and HET mice bones (B) Von Kossa stained sections of femurs from mice of the indicated genotypes. Black stained areas represent mineralized bone tissue. Note the significantly decreased mineralization in the KO mice bone sample (C) Quantitative histomorphometric analyses of postnatal day 18 day mice. We did not observe differences between wild-type and heterozygous mice, therefore, we compared KO data (n = 3) with WT and HET data combined (WT+HET, n = 5). Wild-type-WT, heterozygote-HET, knockout-KO. BV/TV%-bone volume/tissue volume, Md.V/TV%-mineralized volume/tissue volume, Tb.N-Trabecular number (1/mm), Tb.Th-Trabecular thickness (micrometers). *p<0.05.

