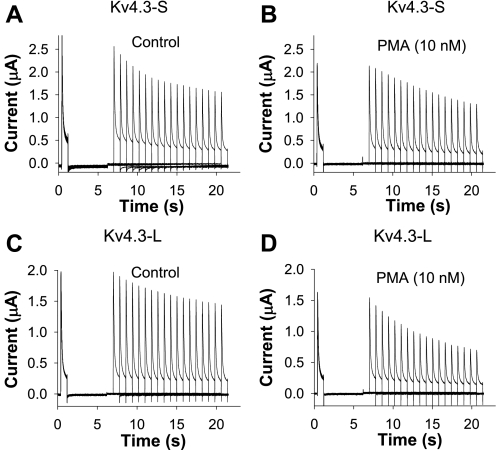
Fig. 3.
Effects of PMA on closed-state inactivation of Kv4.3-S (A and B) and Kv4.3-L (C and D). Voltage-clamp protocol consisted of 4 pulses (HP = −100 mV): a pulse P1 (+40 mV, 800 ms in duration), P2 (−100 mV, 5,000 ms), P3 (−50 mV, 800–14,400 ms), and P4 (+40 mV, 800 ms). Current is plotted as a function of time in control (A and C) and during exposure to PMA (B and D). Data show opposite effects of PMA on closed-state inactivation in Kv4.3-S and Kv4.3-L, which are plotted in Fig. 4, A and B.

