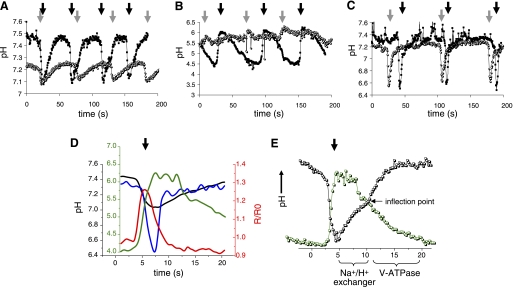
Fig. 3.
Analysis of intestinal pH dynamics in free-range worms. Representative traces from single 72-h posthatch animals show intracellular pH oscillations (A), luminal pH oscillations (B), and basolateral, extracellular pH oscillations (C) in control (▪) and vha-6(RNAi) (○) worms imaged over 200 s while moving freely on bacteria-seeded plates. pBoc is signified by dark arrows (control) and gray arrows (vha-6) to show time intervals for a complete defecation period in the worms. Intracellular and luminal data (A and B) were collected from worms in which RNAi feeding was initiated upon hatching. Because the extracellular pH biosensor is not expressed well in larva, to allow development to adulthood, we collected basolateral data (C) from worms exposed to RNAi at the L3 stage. Their older age likely accounts for their somewhat extended defecation period. Average traces of single cycles from multiple worms are shown in the supplemental data, and statistics are provided in Table 1. D: representation of intestinal pH [intracellular pH (pHi, black trace), luminal pH (green trace), and basolateral, extracellular pH (blue trace)] and calcium oscillations (red trace) during defecation. All traces are plotted to the axis of the same color, except the basolateral trace, which is plotted to the black axis, the same as pHi. Individual traces have been normalized to the execution of pBoc at the start of defecation but were collected from separate worms and are not intended to depict exact temporal or causal relationships. R/R0, ratio normalized to time 0. E: biphasic kinetics of pHi recovery suggest that 2 ion transport processes function in sequence (black trace). The first phase is predicted to occur through Na+/H+ exchange, as indicated, which facilitates recovery from acidification in most cell types. This phase exhibits pH dependence and an apparent plateau near the inflection point. Whether these protons are exported from the cell across the basolateral or the apical membrane is unknown, although luminal pH is relatively stable during this first phase of cytoplasmic recovery (green trace). The second phase is clearly noted after the inflection point in the pHi trace. During this phase, luminal pH begins to decrease as a result of proton pumping at the apical membrane, and the cell is driven to become more alkaline. Traces were not extracted from a single animal, and the relationship between cytoplasmic and luminal pH is intended to be representative, rather than absolute. Scale has been optimized for comparison (for actual values see Table 1)

