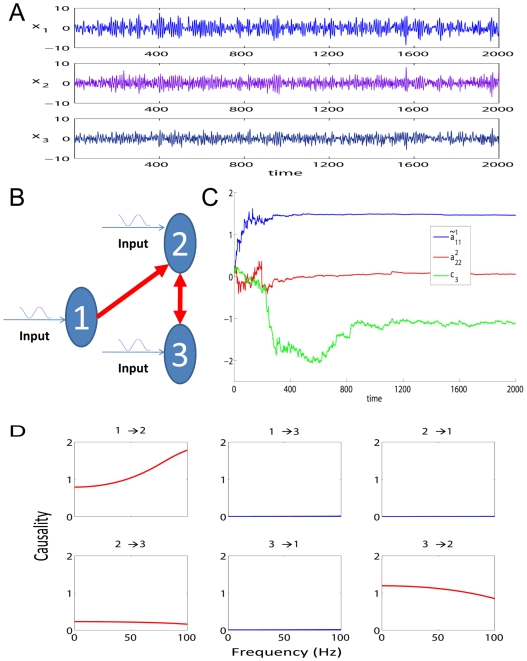
Figure 1. Results on Toy Model 1.
A. Traces of the time series. B. The causal relationships considered in Toy Model 1 between the three state variables. C. The estimated parameters  ,
,  , and
, and  for the simulated data in Toy Model 1. The initial values of the three parameters are all set to 0. The covariance matrix
  is first set to decay slowly to achieve faster convergence and then set to decay faster after two hundred time points to ensure a better accuracy. D. Frequency decomposition of all kinds of relationships between the state variables. Significant causal influences are marked by red.

