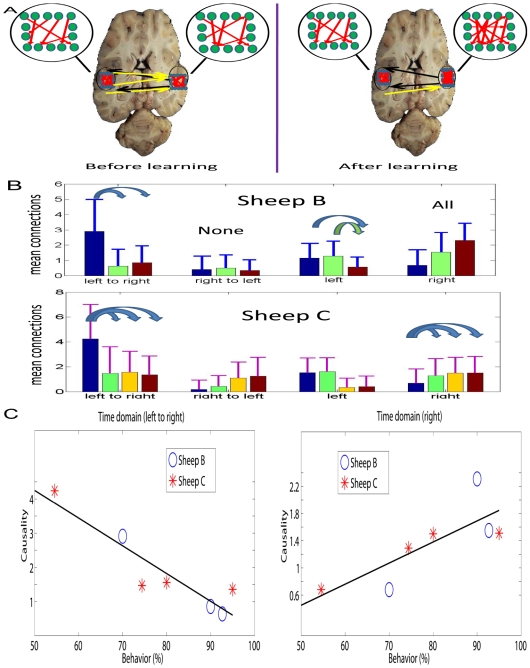
Figure 4. Asymmetry between left and right hemisphere in the time domain.
A. A summary of the results in B, but locations in inferotemporal cortex are not precise, only for illustrative purposes. B. The mean connections from left hemisphere to right hemisphere, right hemisphere to left hemisphere and within both regions with the three bars corresponding to the results before learning (blue bar), after learning (green bar), and one month after learning (purple bar) in Sheep B. Significant changes after t-test are marked by arrows (right to left, all pairs are not significant, as indicated by “none”; within the right hemisphere, all pairs are significant, marked by “all”) . For Sheep C, an additional bar (one week after learning) is added (the third bar). Only significant changes from left to right and within the right hemisphere are indicated by arrows. C. Statistic summaries of results in B.

