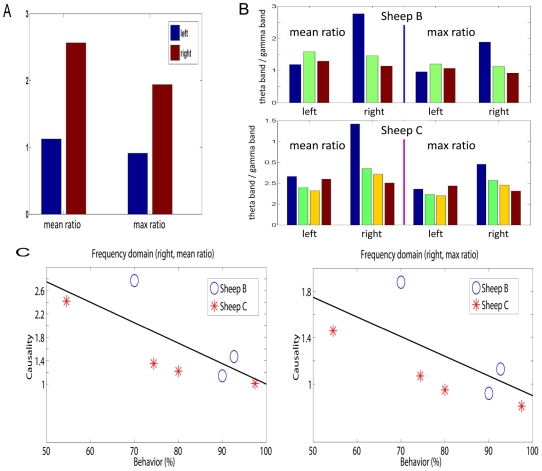
Figure 5. Asymmetry in the frequency domain interactions.
A. Mean and maximum ratio using all the three sheep before and after learning. B. Upper panel: Mean and maximum ratio of sheep B (see Experiment subsection in Methods section) before learning, after learning and one month after learning (see Fig. 4). Bottom panel: Mean and maximum ratio of sheep C before learning (the first bar), immediately after learning (the second bar), one week after learning and one month after learning (the third and the fourth bar). C. Summaries of results in B.

