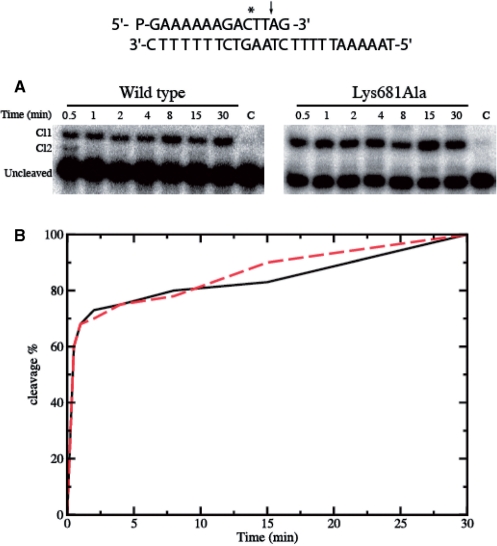
Figure 3.
Suicide cleavage experiment for the wild type and Lys681Ala mutant. (A) Time course of the suicide cleavage reaction carried out with the substrate described on the top of the figure. CL1 and CL2 identify the cleaved complexes at the site indicated by the arrow and the asterisk respectively. Lane C, no protein added. (B) Percentage of the DNA substrate cleaved plotted at different time for the wild type (black line) and the Lys681Ala mutant (red line).

