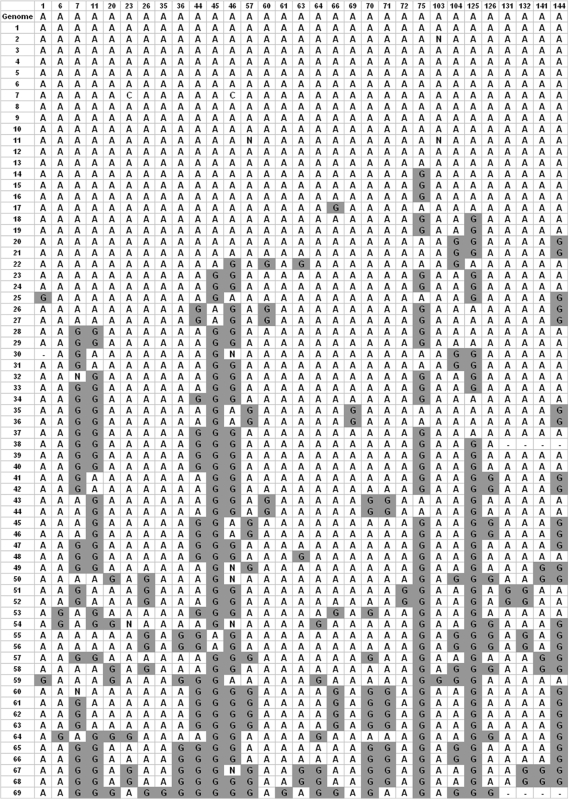
Figure 1.
Multiple alignment of editing locations. Graphical representation of the alignment with the edited clones. The first row represents the DNA root sequence and the following rows represent clones of RNA. Only locations that have at least one editing event are shown. The filled rectangles with ‘G’ represent editing events. Column numbering gives the location in the complete alignment.

