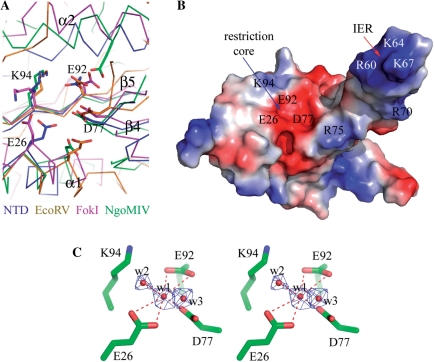
Figure 2.
Catalytic site of the NTD. (A) The NTD is superposed with other restriction endonucleases. The Cα tracings of NgoMIV, EcoRV, FokI and HsdR_Vv (NTD) are differentiated by colors. The catalytic residues are displayed by stick models. For clarity, only the HsdR_Vv residues are labeled. (B) Surface potential presentation of the NTD with similar orientation to (A). The positively and negatively charged surfaces are colored in blue and red, respectively. The key residues for DNA binding and subsequent restriction are indicated on the surface. (C) Stereo-representation of a catalytic site. The catalytic residues for nuclease activity are displayed with stick models and three water molecules bound at the catalytic site by red dots. The 2Fo-Fc density (blue) for the water molecules at the restriction site were contoured at 2.0σ. The hydrogen bonds among the protein side chain atoms and water molecules are displayed by red-dotted lines.

