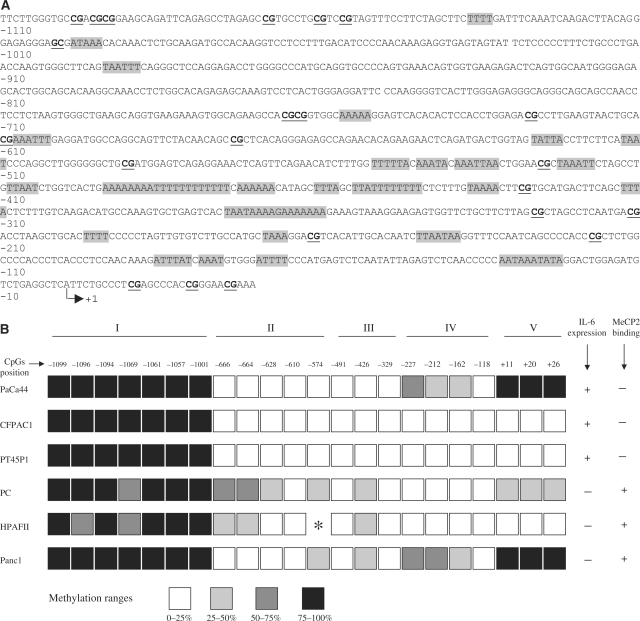
Figure 5.
Schematic map of the methylation status of the IL-6 upstream region. (A) Sequence of the IL-6 upstream region. CpGs are underlined and (A/T) > 4 motifs are marked with shaded boxes. (B) Numbers at the top of the squares represent the position of 22 consecutive CpGs located from −1099 to +26 respect to IL-6 transcriptional start site. CpGs are clustered into five groups (I, II, III, IV and V) and methylation levels are represented by four ranges, as indicated at the bottom of the figure. Asterisk indicates the presence of a G to T mutation.

