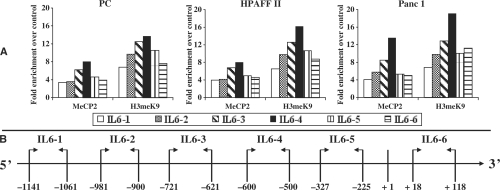
Figure 7.
Systematic ChIP analysis of the IL-6 5′-flanking region. ChIP, qPCR and data analyses were performed as reported in ‘Materials and Methods’ section. DNA from each cell line was immunoprecipitated in the absence or presence of the antibodies against MeCP2, H3meK9 and a non-specific antibody (IgG). qPCR for each ChIP-DNA sample was performed with six primer pairs spanning from −1141 to +118 relative to IL-6 transcriptional start site (+1). Results are reported as fold enrichment of immunoprecipitated DNA from each sample relative to the DNA immunoprecipitated with the non-specific antibody (control), and were plotted in a scale in which the final value of IgG was arbitrarily set to 1. (A) ChIP analysis of IL-6 in the three non-expressing cell lines. (B) Location of the PCR products analysed in A on the IL-6 flanking region.

