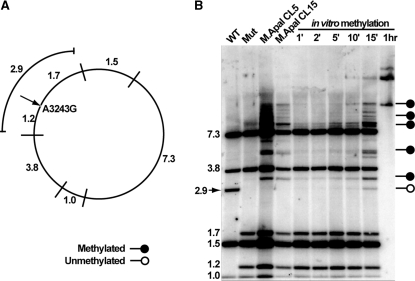
Figure 2.
Southern blot methylation assay showing partial methylation of cells expressing ApaI methyltransferase. Panel A shows the expected band sizes after ApaI restriction endonuclease digestion of the human mtDNA harboring the MELAS A3243G mutation. The arrow shows the mutated 3243 site (an ApaI site), within the binding site of mTERF1. If this site is not digested, the 1.2 and 1.7 kb bands merge into a 2.9 kb band. Panel B shows the Southern blot of DNA from the mutant cells after expression of M.ApaI and controls. The absence of the 2.9 kb band in the M.ApaI expressing clones indicates methylation protection at the 3243 G position. The arrow in panel B indicates wild-type band which is absent from samples that have the MELAS mutation. Methylation of naked DNA (in vitro) does not protect the 3243G.

