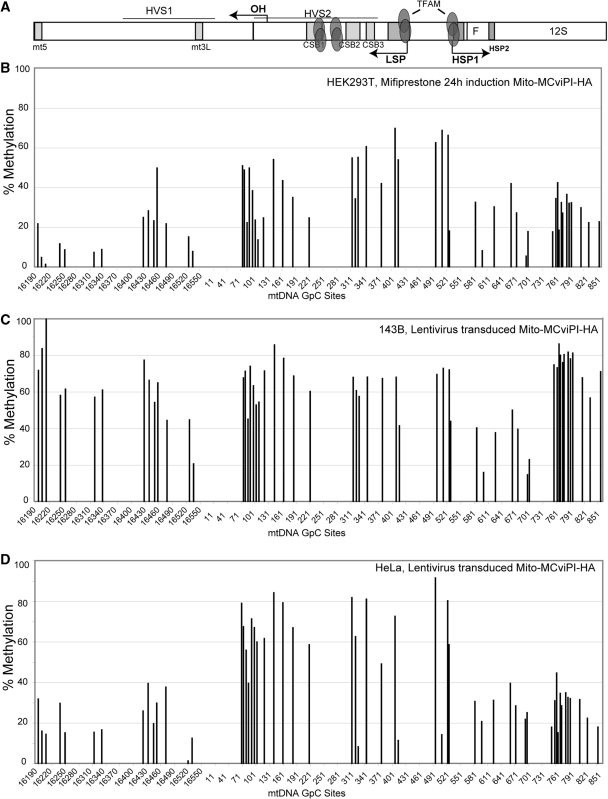
Figure 4.
In vivo mtDNA methylation in the NCR (D-loop region) in different cell lines. Following in vivo methylation by M.CviPI-HA, either by mifiprestone induction (B) or by transduction with a lentiviral vector (C and D), total DNA was purified and bisulfite treated. Sequencing electropherograms from treated DNA were analyzed and compared to a non-methylated reference sequence. DNA methylation was quantified by the percentage drop of Ts (converted Cs) relative to its neighboring peaks (see methods). (A) Diagram showing a map of the major non-coding region (NCR) of the mtDNA indicating the position of conserved sequence boxes (CSBs), promoter regions (LSP and HSP) and other conserved cis-elements. It also shows high affinity TFAM binding sites. (B–D) mtDNA methylation levels in HEK293T (B), 143B (C) and HeLa (D) cells.

