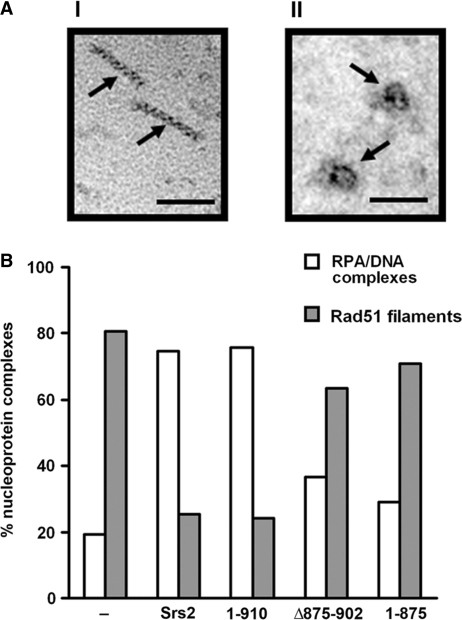
Figure 7.
Quantification of Rad51 presynaptic filament disruption by electron microscopy. (A) Representative Rad51 nucleoprotein filaments (I) or RPA-ssDNA complexes (II) assembled on 150-mer ssDNA. The scale bar represents 50 nm. (B) Distribution of Rad51 presynaptic filaments and RPA-ssDNA complexes observed following incubation without or with 100 nM Srs2, srs2 1–910, srs2 Δ875–902 or srs2 1–875.

