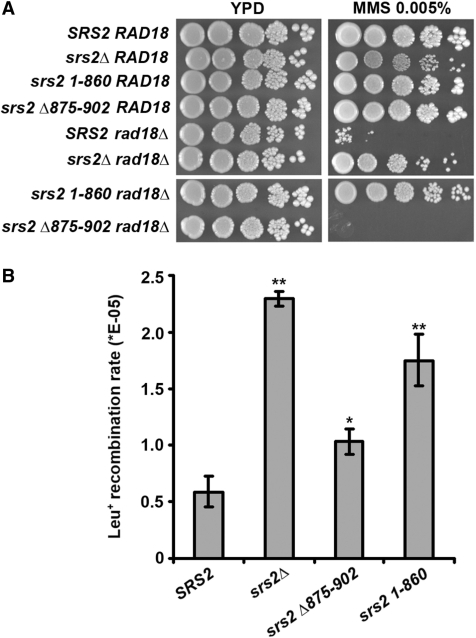
Figure 8.
Phenotypic analysis of srs2 1-860 and srs2 Δ875-902. (A) The ability of the srs2 1–860 and srs2 Δ875–902 alleles to suppress the MMS sensitivity of rad18Δ cells was examined. Platings on both YPD and YPD containing 0.005% MMS are shown. (B) Rates of recombination between the leu2-RI and leu2-bsteII alleles were determined and the results graphed. The rates shown represent the mean from three independent fluctuation tests performed for each strain. Error bars are the standard deviations derived from this mean of three independent rate determinations. Asterisks denote significant results, as determined by t-tests: **P < 0.005; *P < 0.05. Specifically, the rates for SRS2 and srs2Δ875–902 are significantly different (P = 0.00004), the rates for SRS2 and srs2 Δ875–902 are marginally different (P = 0.0117), and the rates for SRS2 and srs2 1–860 are significantly different (P = 0.0016).

