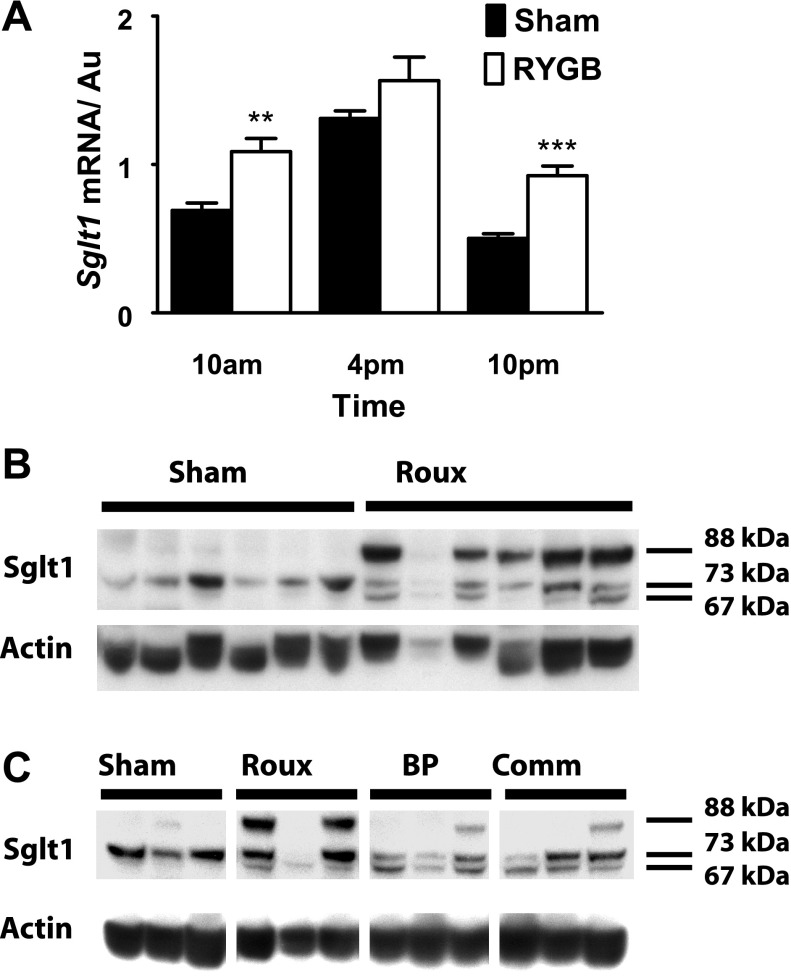
Fig. 6.
A: Sglt1 transcriptional data, expressed relative to Actin and indexed to a standard. Both RYGB and sham animals show an expected diurnal rhythm, but it is blunted in RYGB, with increased basal expression (compared with shams: **P < 0.01; ***P < 0.001). B: a representative Western blot for Roux and sham tissue harvested at HALO-15; in sham tissue, there is a single band seen at 73 kDa. After RYGB, there are additional species seen at 67 and 88 kDa. C: a representative Western blot image for sham jejunum vs. Roux, BP, or common limbs. Note, the samples from RYGB animals are taken from the same 3 animals for each of the Roux, BP, or common channels. In RYGB animals, deglycosylated Sglt1 is seen in all 3 limbs, regardless of nutrient or BP exposure. However, the heavy species of Sglt1 at 88 kDa is more pronounced in the Roux limb compared with those exposed to BP secretions.

