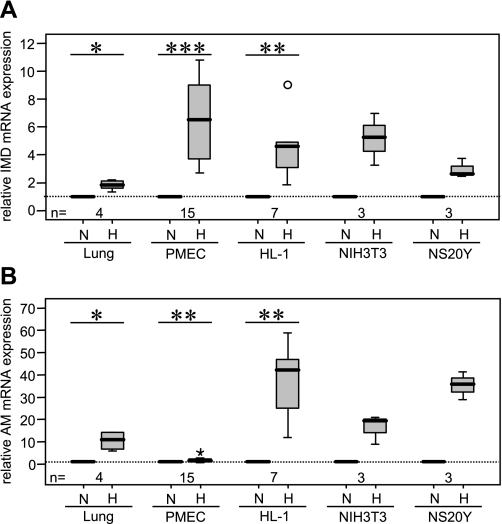
Fig. 2.
IMD expression is induced by hypoxia. Hypoxia caused an increase in IMD (A) and AM (B) mRNA expression in lungs of mice housed under hypoxic conditions (15 h, 10% O2) and in murine PMEC, HL-1 cardiomyocytes, NIH3T3 fibroblasts, and NS20Y neuroblastoma cells treated with hypoxia (6 h, 1% O2). Percentiles 0, 25, 50, 75, and 100 are presented in box plots. Differences among experimental groups were analyzed first with the Kruskal-Wallis test and, if significant differences were observed, with subsequent Mann-Whitney test. Star and circle represent data beyond 3 SD. N, normoxia; H, hypoxia. *P ≤ 0.05, **P ≤ 0.01, ***P ≤ 0.001.

