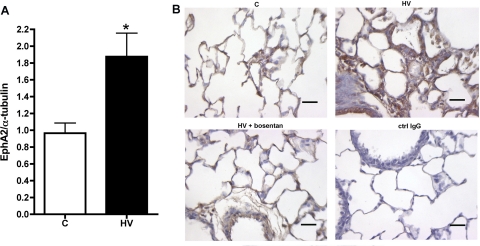
Fig. 2.
A: increased EphA2 protein expression in HV lungs compared with normal control (C), shown by Western blot and densitometry of EphA2 bands normalized to α-tubulin. n = 5 per group; *P < 0.01 vs. normal controls. B: increased EphA2 immunostaining (brown) in distal lung of HV animals (top, right) compared with control (top, left). Scale bar = 50 μm. ctrl, Control.

