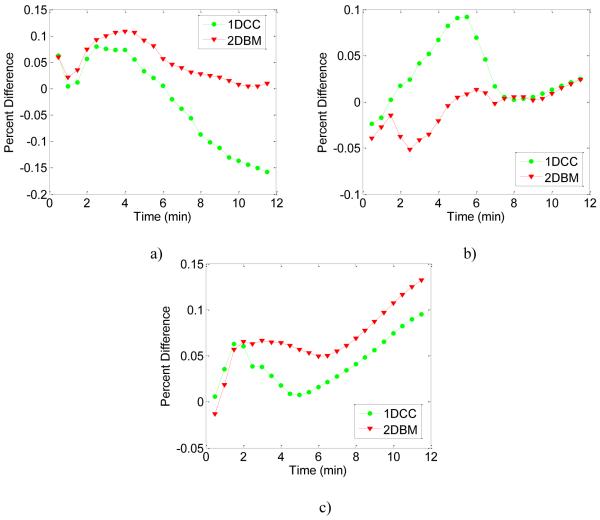
Figure 9.
Comparison of the percent difference or error between temperature estimates calculated using 1D CC and 2D BM based temperature algorithms using the calibration curve versus the “ideal” FEA temperature. The red curve denotes 2D BM and the green curve 1D CC results. The percent difference in temperature was computed for the three ROI shown in Figure 8, at the a) tine (left side), b) simulated liver (right side) and at the d) center.

