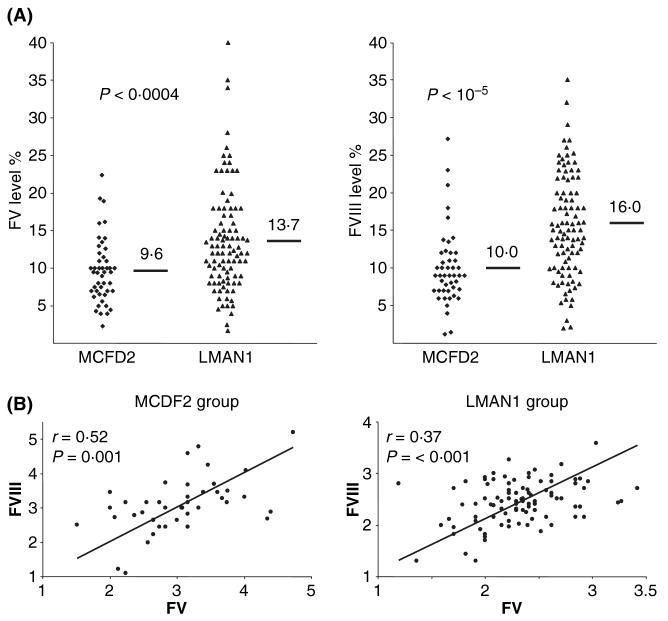
Fig 1.
Genotype–phenotype correlation in F5F8D. (A) Correlation of LMAN1/MCFD2 mutations and FV/FVIII levels. The short bars and numbers indicate the average values. (B) Pearson correlation analysis of FV and FVIII levels in LMAN1 mutation group and MCFD2 mutation group of patients. This research was originally published in Zhang et al (2008), © The American Society of Haematology.

