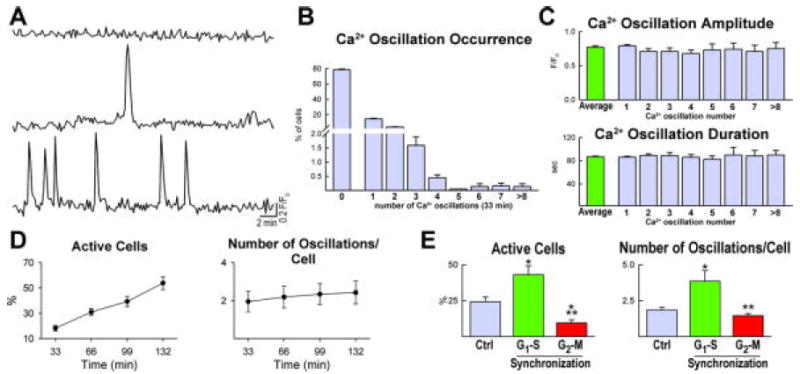
Figure 1.

Intracellular Ca2+ in hCPCs. A, Cytosolic Ca2+ levels in a quiescent hCPC (upper trace) and in two hCPCs showing single (middle trace) and multiple (lower trace) Ca2+ oscillations. B, Distribution of Ca2+ oscillations, from 1 to more than 8, in hCPCs over a period of 33 min. C, Amplitude and duration of Ca2+ events in hCPCs. D, Ca2+ oscillations in hCPCs (Active Cells) analyzed for a period of 132 minutes. E, Ca2+ oscillations in hCPCs in control condition (Ctrl) and at the G1-S and G2-M transition.
