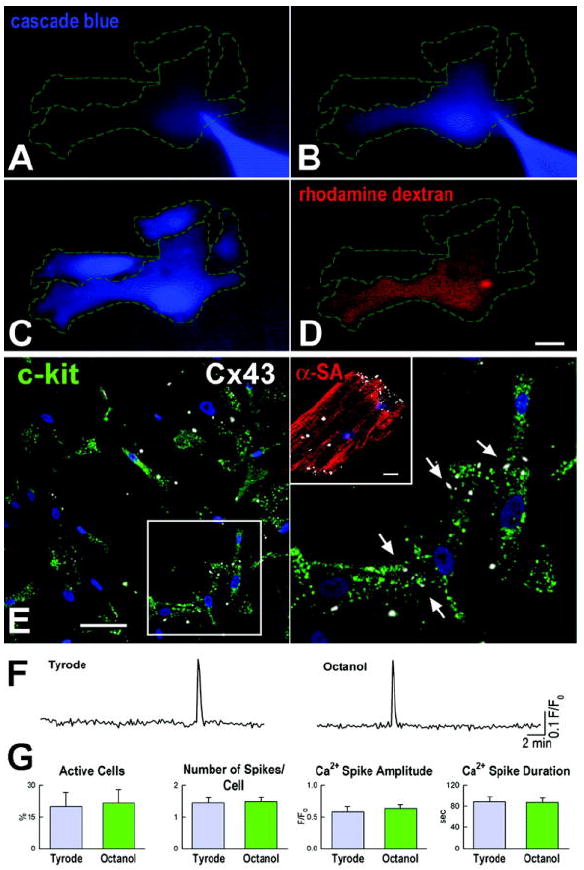
Figure 2.

Cell-to-cell interaction and Ca2+ oscillations. A-C, Cascade blue (blue) microinjected in a single hCPC (A) translocated spontaneously to adjacent cells (B and C). D, Rhodamine-labeled dextran (red), delivered simultaneously with cascade blue, remained confined to the injected cell. Scale bar: 20 μm. Cascade blue translocation was detected in 6 experiments. E, Connexin 43 (Cx43, white) is present between hCPCs (c-kit, green). Nuclei are stained by DAPI (blue). Scale bar: 20 μm. A group of cells is shown at higher magnification on the right panel. The inset shows Cx43 labeling in a myocyte [α-sarcomeric actin, (α-SA) red]. Scale bar: 10 μm. F, Intracellular Ca2+ in hCPCs before (left trace) and after exposure to octanol (right trace). G, Effects of uncoupling on Ca2+ oscillations.
