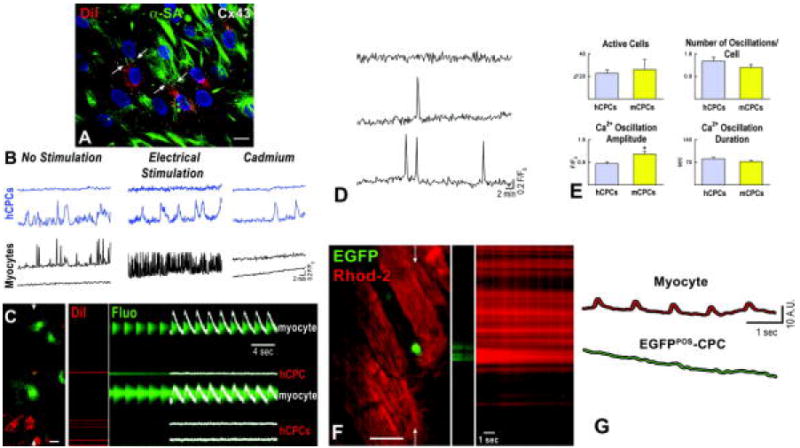
Figure 3.

Ca2+ cycling in myocytes and CPCs. A, Cx43 (white) between DiI-labeled hCPCs (DiI, red) and myocytes (α-SA, green). Nuclei are identified by DAPI. Scale bars: 10 μm. B, Intracellular Ca2+ in hCPCs (blue traces) and adjacent co-cultured neonatal myocytes (black traces). The effects of electrical stimulation and cadmium chloride are also shown. Different cells were used in the three conditions. C, Intracellular Ca2+ in hCPCs and neonatal myocytes in line scan mode. Red identifies hCPCs loaded with DiI and green corresponds to Fluo-3; scale bar: 20 μm. D, Cytosolic Ca2+ in a quiescent mCPC (upper trace) and two mCPCs showing a single (middle trace) and multiple (lower trace) Ca2+ oscillations. E, Properties of Ca2+ oscillations in hCPCs and mCPCs. E, c-kit-EGFP mouse heart loaded with Rhod-2 (red), stimulated at 1 Hz and analyzed in line-scan mode (arrows). CPCs were identified by EGFP (green). G, Ca2+ transients in myocytes (red trace) did not affect Ca2+ levels in the neighboring EGFP-positive CPC (green trace). Identical results were obtained in 7 other experiments. Scale bars: 20 μm.
